Atlantic rain came first in the forecast
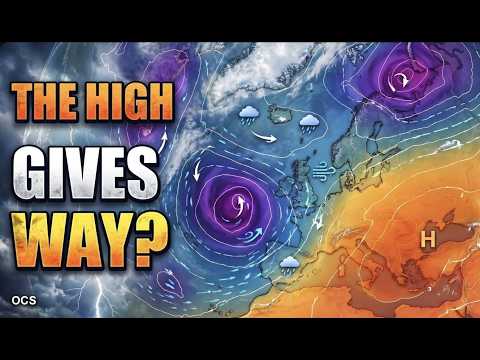
The first week of the outlook focused on an Atlantic low and spells of wind and rain in northwestern Europe. In the GFS run, the low deepened to around 953 hPa at midday UTC on 16 November. The animated pressure and rain maps show which bands reach land as the low moves across the Atlantic.
Further north, the same run showed falling snow in parts of Norway at 00:00 UTC on 18 November. That layer shows the type of precipitation the model expects at a given time. How much settles depends on how long it falls and the conditions at the surface.
Oslo had the clearest colder signal
For 22–29 November, the forecast compares Oslo, Warsaw and Berlin. At midday UTC on 29 November, 24 of 30 GEFS members with varied starting conditions put the Oslo model point below 0°C. The count fell to 10 at Warsaw and four at Berlin. Those counts describe the spread in this particular model cycle. A reliable local probability would need more evidence.
Warsaw illustrates why this matters. Two of the runs shown in the programme ended up more than 7°C apart at the same forecast time. One was dry in the preceding six hours. The other showed 4.2 mm of precipitation in that period, measured as liquid water equivalent. At that range, both the arrival of cold air and the type of any precipitation remained uncertain.
What to look for in later runs
The maps follow a single GFS forecast, and the GEFS ensemble explores several possible outcomes from the same starting cycle. For the later dates, the useful question is whether subsequent runs bring more of those outcomes together near Warsaw and Berlin. Agreement would give more reason to narrow the outlook. Continued spread would leave both colder and milder possibilities in play.
Sources & further reading
Independent background for the ideas explored on this page.